
The TennesseeView Director Dr. Qiusheng Wu was recently interviewed by NASA Landsat Science. Here is the link to the interview.
Dr. Qiusheng Wu is an assistant professor at the University of Tennessee in Knoxville, using geospatial data to study Earth’s changing environment. Wu is strong supporter of open science and reproducible research, and he has developed open-source geospatial analysis tools for everyone to use.
Wu wants anyone to be able to derive meaningful information from Earth observation data, like Landsat. To that end, he has created tools and tutorials to empower data users to ask big questions and use big data to search for the answer.
In our latest series of Landsat Q&As, we are talking with researchers and scientists that are helping Landsat data users harness the power of satellite data analysis that cloud-based, open-source geospatial applications have made possible.
Here’s what we discussed with Wu:

When did you first start using Landsat data?
I studied Geographic Information System (GIS) in college. My first encounter with Landsat data was through Google Earth back in 2004 when I was an undergraduate student. I was fascinated by Google Earth which allowed me to see satellite imagery of cities and landscapes across the globe. Later I worked as a research assistant for my college professor on research projects that utilized Landsat data to do land use and land cover mapping.
Between 2006 and 2008, I heavily used ArcInfo Workstation (a command-line program seen as the predecessor of ArcGIS Desktop) to manually interpret Landsat data and develop land use and land cover products for the research projects. The Landsat knowledge and technical skills I learned in college laid a solid foundation for my academic career.
You are a big supporter of open science and open data. What is the importance of free and open Landsat data?
I am an advocate of open science and reproducible research. I started using Landsat data almost two decades ago, a few years before USGS adopted the free and open Landsat data policy in 2008. The importance of free and open Landsat data cannot be overstated.
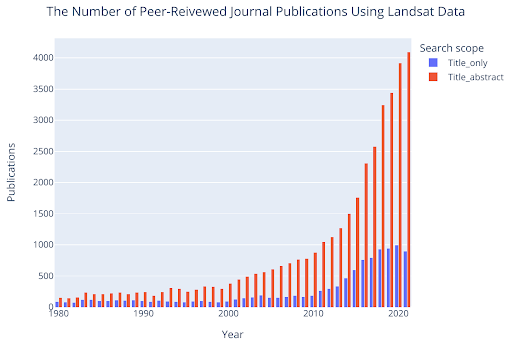
Landsat data have empowered numerous Earth science applications at local, regional, and global scales. Since USGS made Landsat data freely available in 2008, there has been an exponential growth in the number of peer-reviewed journal publications empowered by Landsat data. Based on my most recent bibliometric analysis, there are 11,311 peer-reviewed journal publications with the word “Landsat” in the title and 38,894 publications with the word “Landsat” in either the title or abstract. In 2021, the number of publications with “Landsat” in the title or abstract surpass 4,000, which is more than a fivefold increase from the year 2008 with only 770 publications.
The adoption of Landsat data by popular cloud computing platforms (e.g., Google Earth Engine, Microsoft Planetary Computer) also contributes to the exponential growth in the number of “Landsat” publications during the past few years. Given the recent release of Landsat 9 data, I believe this upward trend will continue in the coming years.
You created an interactive web app that allows users to create time series animation for any location around the world using Landsat or GOES data in about a minute. What has user reaction to this app been?
In October 2021, I developed and released the interactive streamlit web app for creating satellite timelapse animations for any location around the globe in less than 60 seconds.
Check out the blog post and video tutorial on how to use the web app.
Since its release, the app has been widely circulated on social media. People all over the world have been using the web app to create interesting satellite timelapse animations featuring environmental changes, such as urban growth, land reclamation, river dynamics, vegetation dynamics, coastal erosion, volcanic eruption.
In particular, I would like to highlight two champions of the web app: Brendan Conway and Andrew Nelson. They have been constantly sharing interesting timelapse animations during the past few months. Check out the hashtags #streamlit on Twitter and #BigRiverAnimation on LinkedIn for some interesting timelapses.
Brendan Conway also created an excellent video showing how to visualize geographical processes using the timelapses created using the web app.
You have a geospatial tutorial YouTube page and you have given talks to groups like Youth Mappers. What inspires you to share your time and the tools you create?
I have been inspired by Dr. John Lindsay, who developed an amazing geospatial data analysis platform called WhiteboxTools. It is a command-line program with 500+ open-source tools for geospatial analysis. The analytical backend of this program was developed using the Rust language.
Inspired by Dr. Lindsay’s great work, I developed four frontends for WhiteboxTools, including whitebox-python, whitebixgui, whiteboxR, and whitebox-ArcGIS, making WhiteboxTools more accessible to the geospatial community. In addition to the WhiteboxTools frontends, I also developed several open-source Python packages (e.g., geemap, leafmap, lidar).
Geemap provides users with an intuitive graphical user interface to manipulate, analyze, and visualize geospatial big data interactively with Google Earth Engine in a Jupyter environment. Geemap was initially created in Spring 2020 to support teaching GEOG-414 (Spatial Data Management) at the University of Tennessee. Since its initial release on GitHub in March 2020, geemap has been widely used by the geospatial community. As of February 2022, geemap has gained 1,7K+ stars and 680+ forks on GitHub.
In summer 2020, I created my YouTube channel to share geemap and GeoPython tutorials. Since then, my YouTube channel has gained 12K+ subscribers, 400K+ views, and 19K+ watch hours. I am pleased to see that my work is making a positive impact on the geospatial community.
My goal is to make open-access satellite data more accessible to the geospatial community and beyond by lowering the barrier to analyze and visualize geospatial big data.
As a professor, many of your Geography courses include programming instruction. How have tools like Google Earth Engine, R, Python, and Jupyter Notebooks changed the scope of and utility of remote sensing data?
In the past, I heavily relied on proprietary GIS and remote sensing software for teaching. I have now transitioned to primarily using open source software for research and teaching. More and more free cloud computing platforms have become available for research and teaching, such as Google Earth Engine, Google Colab, Microsoft Planetary Computer, Amazon SageMaker Studio Lab. In addition, Jupyter Notebook has been a game-changer for open science and reproducible research.
These free cloud computing platforms and open-source software tools make teaching programming courses much easier. Students can learn how to write computer programs and analyze geospatial big data from anywhere with just an Internet browser.
Why is it important for your students to have a basic programming skill set?
Having a basic programming skill set is important today because so much of our world is now automated. It is even more important for people in the geospatial community because we heavily rely on massive geospatial datasets to tackle global social and environmental issues.
Computer programming can help address these global challenges by automating processes, collecting data, analyzing data, and visualizing results more effectively and efficiently. For example, to study global vegetation dynamics during the past decades, it could take days/weeks to download and analyze Landsat data. With a basic programming skill set, it might take only a few minutes/hours to carry out the same task using cloud computing platforms, such as Google Earth Engine and Microsoft Planetary Computer.
For new Landsat data users, what resources would you recommend to start looking at and analyzing Landsat data?
I would recommend the following resources for new Landsat data users:
- Google Earth Timelapse: Explore Landsat timelapses around the world in 3D.
- Streamlit for Geospatial: Create and download satellite timelapses with custom visualization parameters for any location around the world in less than 60 seconds.
- USGS LandsatLook: Explore Landsat Collection 2 data with a custom area of interest, band combinations, and spectral indices.
- Google Earth Engine: View and analyze the Landsat archive with only a few lines of code.
- Microsoft Planetary Computer: Explore Landsat 8 Collection 2 data in a JupyterHub environment.
- EarthExplorer: Search and download Landsat data.
- NASA Landsat Science: Learn about the NASA/USGS Landsat Program, news, data, applications, outreach, etc.
Are you looking forward to using Landsat 9 data?
Absolutely! I have been looking forward to using Landsat 9 data since NASA and USGS released the first Landsat 9 images on Nov. 5, 2021. I was very excited when the USGS started making Landsat 9 data publicly available on Feb. 10, 2022.
Shortly after the release, the Google Earth Engine team started ingesting Landsat 9 data into the Earth Engine Data Catalog. As of Feb. 19, 2022, there are 28,224 Landsat 9 images available in Earth Engine. The ingestion process is still ongoing. Hopefully, all existing Landsat 9 images will be ingested in the coming weeks.
While the ingestion process is ongoing, I created a video tutorial showing users how to visualize Landsat data with Google Earth Engine and geemap. A Jupyter notebook accompanying the video is available here.